Phase 1 - Part 4: Impact Vertical Chain Template & Scenario Modeling Structure
A Vertical Approach for Cardano Vertical-to-KPI Impact Framework
Executive Summary: This document delivers the fourth and foundational Phase 1 output: a reusable Impact Vertical Chain Template and Scenario Modeling Structure that any Cardano vertical team can apply to map real-world activities to on-chain events and 2030 North Star KPIs.
Project: A Vertical Approach for Cardano — Vertical-to-KPI Impact Framework
Author: Benjamin Ben Zvi - ELK GmBh
Document Type: Phase 1 Foundational Research (Covers Proposal Tasks P1-1 and P1-2)
Release Date: August 2026
Table of Contents
- Introduction
- Purpose of this Document
- What this Document Delivers
- How to Use this Document
- Component 1 - Impact Chain
- Purpose & Analytical Rationale
- The Five-Layer Chain Structure
- Visual: Impact Chain Diagram
- Template: Impact Chain (Blank)
- Guidance Notes for Authoring
- Component 2 - Modeling Engine
- Purpose & Standardisation Logic
- The Vertical Lifecycle Timeline (3–5 Years to Scale)
- Scenario Definitions
- Shared Input Variables (Tiers 1–4)
- KPI Output Metrics
- Visual: Modeling Output Table
- Template: Input Sheet (Blank)
- Guidance Notes for Modeling
- Component 3 - Taxonomy
- Purpose & Diagnostic Value
- Five Constraint Categories
- Visual: Taxonomy Matrix
- Template: Assessment (Blank)
- Interpreting Readiness Scores
- Component 4 - Scorecard (v1)
- Purpose & Governance Function
- Architecture (Sections A–E)
- Visual: Impact Scorecard Form
- Guidance for Scorecard Reporting
- Framework Integration
- The Logical Sequence
- The Dynamic Feedback Loop
- Cross-Vertical Comparability
- Validation Plan
Appendix A - Glossary
Appendix B - Proposal Deliverables
1. Introduction
1.1 Purpose of this Document
This document delivers the fourth and final Phase 1 output of the Vertical-to-KPI Impact Framework project funded by the Intersect Product Committee. The primary objective of this overall initiative is to transition the Cardano ecosystem from fragmented, speculative business development (BD) into a rigorous, evidence-grounded vertical strategy where every funded initiative explicitly maps its operational activities to Cardano’s 2030 North Star Key Performance Indicators (KPIs).
Per the funded proposal, Phase 1 establishes the empirical, analytical, and methodological foundations across four core deliverables:
1. Review and synthesise all existing Cardano 2030 KPI definitions - delivered in Deliverable P1-1+2.
2. Audit existing vertical reporting approaches across Cardano ecosystem teams - delivered in Deliverable P1-1+2.
3. Benchmark methodologies from adjacent ecosystems (Polkadot, Ethereum ecosystem funds, Cosmos, Avalanche, Solana) - delivered in Deliverable P1-3.
4. Draft the initial Impact Vertical Chain Template and Scenario Modeling Structure - delivered in this document (P1-4).
While Deliverables P1-1+2 and P1-3 established the diagnostic findings - specifically identifying pervasive reporting failures, the total absence of causal links connecting real-world adoption to on-chain metrics, and the lack of a shared evaluation framework - P1-4 represents the first actionable component of the framework itself. It translates diagnostic insights into a modular, repeatable, and mathematically sound toolkit that any Cardano vertical lead, ecosystem builder, or funding committee can directly deploy.
This document represents the beginning of this work: the frameworks, templates, and taxonomies presented here are functional but not yet complete. They will be further developed, refined, and validated in the subsequent phases of the project.
1.2 What this Document Delivers
This document provides four interconnected framework components designed to operate as a unified evaluation and reporting suite:
- Component 1 - The Impact Vertical Chain Template: A five-layer causal architecture tracing how real-world participants executing everyday economic or operational activities generate specific on-chain events that directly move Cardano’s 2030 KPIs.
- Component 2 - The Scenario Modeling Engine: A standardised forecasting methodology modeling vertical adoption across three rigorous scales - Conservative, Moderate, and Optimistic - utilising uniform input variables and generating on-chain usage and projects that can be easily compared against Cardano’s KPI metrics.
- Component 3 - The Bottleneck & Enabler Taxonomy: A structured diagnostic classification system spanning five core operational categories (UX & Tooling, Liquidity & Economics, Regulatory & Compliance, BD Capacity & Market Access, Ecosystem Infrastructure & Coordination) to evaluate ecosystem readiness and pinpoint adoption constraints.
- Component 4 - The Vertical Impact Scorecard (v1): A standardised, self-service one-page planning and quarterly reporting instrument enabling vertical leads to set trajectory targets, report actuals, track BD pipelines, and maintain governance accountability to Intersect and Delegated Representatives (DReps).
1.3 How to Use this Document
This document is intentionally constructed as an active, working operational template rather than a theoretical white paper. Each component contains structured frameworks, defined parameters, blank template tables, and field-tested completion rules.
The templates are deliberately domain-agnostic to ensure full reusability across diverse market verticals. Whether applied to complex real-world asset tracking (e.g., Agricultural Supply Chains), high-velocity financial primitives (e.g., Bitcoin DeFi), or decentralised civic coordination (e.g., Governance), the analytical path remains invariant.
Operational Rule for Vertical Teams
Vertical teams deploying these templates must adhere to four baseline operating principles:
- Sequential Execution: Always execute the components in order (Impact Chain → Scenario Modeling → Bottleneck Diagnosis → Scorecard Rollup), as each layer provides the quantitative inputs for the next.
- KPI Rigour: Map exclusively against the canonical Cardano 2030 KPI definitions codified in Deliverable P1- 1+2.
- Empirical Anchoring: Ground every baseline market input in verifiable real-world industry data or comparable on-chain benchmarks—never unanchored optimism.
- Iterative Validation: Treat all v1 outputs as living analytical models that must be stress-tested against real-world domain experts and ecosystem developers.
2. Component 1 - The Impact Vertical Chain Template
2.1 Purpose & Analytical Rationale
The Impact Vertical Chain is the fundamental analytical building block of the entire framework. It establishes a rigorous, traceable causal path connecting a granular real-world action performed by an industry participant to its direct, quantifiable contribution to Cardano’s 2030 North Star KPIs.
Historically, blockchain vertical proposals have relied on vague generalisations (e.g., “bringing an industry to Cardano will drive mass adoption”). This failure to trace causality creates significant strategic blind spots:
- The Actor Ambiguity: Failure to identify exactly who uses the system, their technical readiness, and their economic motivation.
- The On-Chain Abstraction: Conflating broad business concepts with actual on-chain transaction throughput, state bloat, UTxO creation, and smart contract execution.
- The KPI Disconnect: Inability to prove how specific commercial activities roll up into macro ecosystem health metrics (e.g., Active Wallets vs. Monthly Transactions vs. Protocol Revenue).
The Impact Vertical Chain eliminates this ambiguity by enforcing a strict five-layer decomposition, ensuring that no vertical initiative is funded or evaluated without a clear, verifiable mechanism of action.
Using the chain to decide which vertical to target
The Impact Vertical Chain is not only a reporting instrument, it is a selection and prioritisation tool. Before a vertical receives coordinated ecosystem support, the chain should be completed at a high level as part of the investment case. If a proposed vertical cannot produce a credible chain, because actors are poorly defined, on-chain event types are speculative, or KPI linkages cannot be substantiated, that is a signal that the vertical is not yet ready for coordinated activation, regardless of its intuitive appeal.
Conversely, a vertical that generates a dense, well-evidenced chain with multiple actor types, high- frequency on-chain events, and clear links to the three North Star KPIs presents a strong, defensible case for prioritised investment. The chain therefore serves as an objective basis for comparing candidate verticals and allocating ecosystem resources where the projected KPI contribution is highest.
Establishing why Cardano is the right fit
Completing the chain forces an explicit answer to a question that vertical proposals frequently leave implicit: why Cardano specifically, rather than a competing blockchain or a non-blockchain solution? For each real-world activity in Layer 2, the vertical team must identify the specific Cardano capability that addresses the friction, and explain why that capability is superior to the incumbent alternative. This discipline prevents “blockchain for blockchain’s sake” reasoning and ensures that Cardano’s selection is grounded in genuine technical or economic advantage: UTxO determinism, Plutus contract expressiveness, native multi-asset support, the depth of the DID/identity infrastructure, or the ecosystem’s existing traction in the vertical.
Where a credible Cardano advantage cannot be articulated for a given activity, that activity should be excluded from the chain. The strength of the chain is determined by its most credible linkages, not its length.
The requirement for a strong Vertical Lead
The Impact Vertical Chain is an analytical framework, but its quality is ultimately determined by the expertise of the person completing it. A chain built without deep industry knowledge will surface generic actors, generic pain points, and generic Cardano capabilities, producing projections that cannot withstand scrutiny from domain practitioners or governance reviewers.
A credible Impact Vertical Chain therefore requires a dedicated Vertical Lead with: (I) first-hand knowledge of the target industry’s value chain, actors, and real purchasing dynamics; (II) sufficient understanding of Cardano’s technical primitives to map them accurately onto real-world friction; and (III) existing relationships within the vertical’s commercial or institutional ecosystem. The Vertical Lead is accountable for the chain’s accuracy and for having it validated by external practitioners before governance submission. This is not a role that can be fulfilled by a generalist researcher alone.
2.2 The Five-Layer Chain Structure
The Impact Vertical Chain is evaluated systematically from left to right across five distinct layers:
Layer 1 - Vertical Actors
Identifiable economic agents and participants within the target industry who execute operations that interface with blockchain infrastructure. Crucially, actors must be defined from the perspective of the external industry, not the crypto ecosystem.
- Primary Categories: End Users / Beneficiaries (individuals, retail participants, community members), Operators & Aggregators (intermediaries, verifiers, service coordinators), Commercial Enterprises (organisations, enterprises, liquidity providers), Institutional & Regulatory Bodies (public authorities, standards bodies, oversight institutions), and Capital Providers (funds, insurers, financial intermediaries).
- Required Documentation: Category name, structural role in the industry value chain, total addressable population in target geographies, and primary economic/regulatory incentive for engaging with Cardano.
Layer 2 - Real-World Activities
The discrete, routine business processes or operational actions undertaken by these actors in their standard operating environment, prior to introducing blockchain tooling.
- Representative Examples: Registering parcel boundary coordinates, issuing an export invoice, logging pesticide application, executing cross-border escrow, certifying organic origin, or casting a proxy ballot.
- Required Documentation: Operational activity workflow, current structural friction (e.g., manual reconciliation, fraud, delays, lack of auditability), and specific Cardano technical capability matching the pain point (e.g., Atala PRISM DID, Plutus V3 smart contract, CIP-25/68 metadata anchoring, Hydra payment channel).
Layer 3 - On-Chain Events
The exact, machine-readable blockchain transactions, script invocations, or cryptographic proofs generated when the real-world activity is digitised on Cardano. This is where business operations become tangible ledger activity.
-
Standard Event Taxonomy:
- Identity & Credential Events: Decentralised Identifier (DID) publication, verifiable credential issuance, authentication proofs.
- Transaction & Settlement Events: Native ADA transfers, multi-asset token transfers, batch settlements, escrow lock/release.
- Data & Metadata Events: Metadata anchoring via transaction auxiliary data, state updates, supply-chain batch NFT minting/burning.
- Governance Events: On-chain voting transactions, proposal submissions, stake delegation actions.
- Liquidity & DeFi Events: Collateral locking, liquidity pool deposits, automated market maker (AMM) swaps, borrow/lend interactions.
- Other Events: Any vertical-specific on-chain interactions not captured in the above categories.
-
Required Documentation: Specific event classification, estimated baseline execution frequency per active actor per month, and expected monthly on-chain volume at maturity.
Layer 4 - KPI Contribution Mapping
The mathematical and logical mapping connecting discrete on-chain events to specific Cardano 2030 KPIs. Every event must map to at least one primary KPI and, where applicable, secondary indicators.
-
Core Target KPIs (Canonical 2030 Set):
- Monthly Active Users (MAU): Target 1,000,000 unique active transacting wallets in a rolling 30-day window.
- Monthly Transactions: Target ≥27,000,000 transactions per month across the network.
- Total Value Locked (TVL): Target $3,000,000,000 across smart contracts and liquidity protocols.
- Annual Protocol Revenue: Target ≥16,000,000 ADA/year generated via transaction fees and script execution.
- Governance & Network Health: DRep Participation Rate (>70% active stake), Throughput Capacity (3× scale), Uptime (99.98%), Nakamoto Coefficient (>22 DReps).
-
Required Documentation: Target KPI name, formal contribution formula (e.g., MAU Contribution = Active Actors x Unique Wallet Ratio), and authoritative data verification source (e.g., CardanoScan, Cexplorer, TapTools, custom Indexer).
Layer 5 - Aggregate KPI Impact Projection
The quantitative synthesis aggregating all Actor × Activity × Event pathways into a single consolidated impact projection. This output directly informs strategic resource allocation and governance review.
2.3 Visual: The Impact Vertical Chain Flow Diagram
Figure 1 illustrates the end-to-end structural flow of the Impact Vertical Chain, detailing how real-world participants transition through operational workflows to drive Cardano’s macro ecosystem performance.
| Layer 1: Vertical Actors | Layer 2: Real-World Activities | Layer 3: On-Chain Events | Layer 4: KPI Contribution Mapping | Layer 5: Aggregate Impact |
|---|---|---|---|---|
| Smallholder FarmersCommercial Processors Trade Finance Lenders | Harvest Lot RegistrationEUDR Due Diligence FilingWarehouse Escrow Release | Metadata Batch AnchoringCIP-68 Lot NFT MintingSmart Escrow Script Call | Monthly TransactionsUnique Active WalletsFee Revenue (ADA) | +180k Monthly Tx+15k Active MAU+$4.2M TVL Locked |
Figure 1. The Impact Vertical Chain - tracing real-world industry activity to 2030 North Star KPI contributions. Note: the actors, activities, and events shown above are drawn from an agricultural supply chain example. The specific content will differ for each vertical applying this framework.
2.4 Template: Impact Vertical Chain
This section provides two versions of the Impact Vertical Chain template: a blank master template for vertical teams to complete, followed by a worked example showing how the template is applied in practice.
Version 1 - Blank Template (for completion by vertical teams)
Complete one row per actor–activity pairing identified in your addressable market. Add rows as needed. All fields are mandatory; estimated fields must be tagged [Assumption] and carried into the Scenario Modeling Engine.
| Actor / Category | Real-World Activity | Current Pain Point | Cardano Solution & Fit | On-Chain Event Type | Event Frequency (Monthly) | KPI(s) Contributed | Contribution Logic |
|---|---|---|---|---|---|---|---|
[Actor name or categ ry] | [Real-world operation this actor performs] | [What is broken or costly in today’s approach] | [Specific Cardano capability and why it is superior to alternatives] | [Select from the event taxonomy in Section 2.2] | [Estimated transactions or events per actor per month] [Assumption] | [Name the relevant Cardano 2030 KPI(s)] | [Formula or logic linking event volume to KPI movemen ] |
2.5 Guidance Notes for Completing the Chain
Methodological Rules for Vertical Authors
- Anchor in Industry Realities, Not Blockchain Features: Begin strictly with the real-world participant and their commercial friction. Never start with "Cardano has fast smart contracts" and invent a synthetic use case.
- Maintain Granular Event Classification: Do not label events broadly as "Using Cardano". Explicitly define whether an event is a raw ADA transfer, a Plutus V3 script execution, a metadata anchoring payload, or a minting transaction.
- Distinguish Active Wallets from Transaction Volume: A single commercial aggregator wallet may submit 500 automated batch transactions per month. In this case, ΔMAU = 1, whereas ΔMonthly Transactions = 500. Conflating the two invalidates scenario modeling.
- Tag Assumptions for Sensitivity Auditing: Explicitly mark all estimated input variables with an [Assumption] tag. These variables must be carried forward into the Scenario Modeling Engine for stress testing.
- Mandatory External Practitioner Review: Prior to governance submission, the completed chain must be reviewed and signed off by at least one external commercial practitioner in the target sector.
3. Component 2 - The Scenario Modeling Engine
3.1 Purpose & Standardisation Logic
The Scenario Modeling Engine provides a rigorous mathematical framework that converts the operational pathways established in the Impact Vertical Chain into quantified, multi-year KPI projections. It models adoption trajectories across three standardised scales: Conservative, Moderate, and Optimistic.
In historical ecosystem reporting, vertical teams presented unanchored single-point forecasts that were impossible to verify or compare. The Scenario Modeling Engine enforces a uniform variable schema, ensuring that proposals from entirely disparate sectors (e.g., Agriculture vs. Bitcoin DeFi vs. Civic Governance) can be evaluated side by side by the Intersect Product Committee and DReps on an identical mathematical basis.
3.2 The Vertical Lifecycle Timeline (3–5 Years to Scale)
Scenario modeling must be anchored to a realistic timeline. Verticals do not reach scale in Year 1, and projections that assume rapid adoption without accounting for the time required to build market presence, validate propositions, and convert pipeline into on-chain activity will not survive scrutiny. The following lifecycle framework provides the temporal structure within which all three scenario projections should be interpreted.
Every vertical is expected to progress through four stages. The pace of progression differs by vertical, a vertical with multiple live commercial deployments and institutional partners may be at Stage 2 at launch, while an early-stage vertical may spend its first year completing Stage 1, but the sequence is invariant.
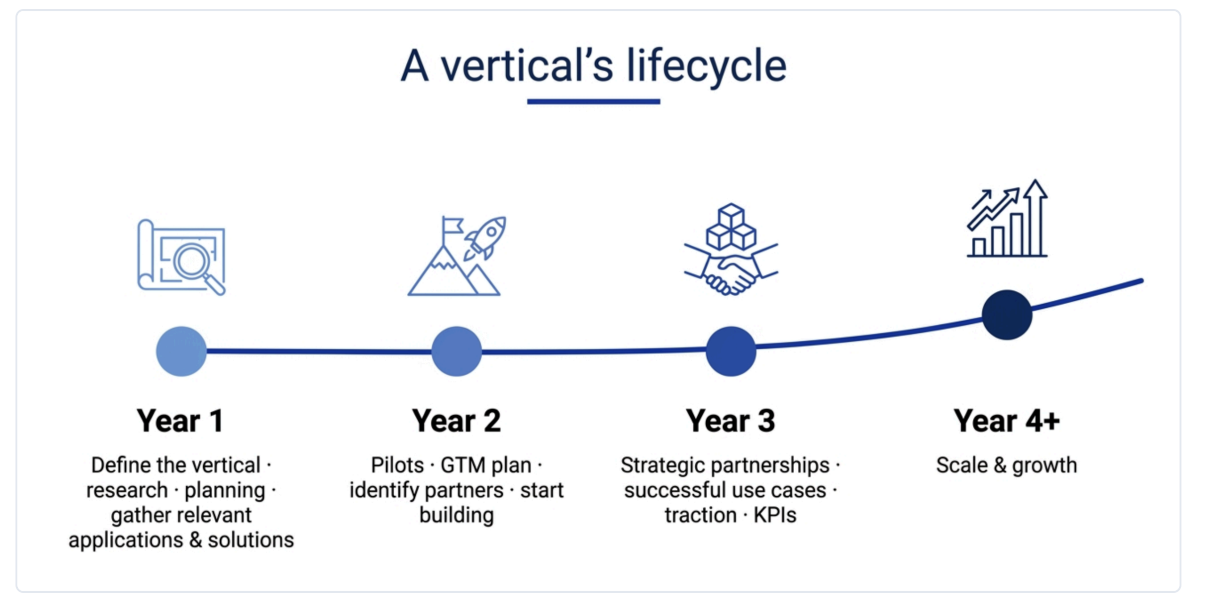
The table below maps each lifecycle stage to its primary objective, the scenario modeling scale it corresponds to, and the expected KPI milestones by end of stage:
| Stage | Primary Objective | Typical Activities | Scenario Alignment | KPI Milestone (end of stage) |
|---|---|---|---|---|
| Year 1 - Define & Research | Establish the vertical’s evidence base and activate initial market presence | Appoint Vertical Lead; complete Impact Vertical Chain; identify top 20 target accounts; begin pilot partner outreach; gather existing solutions and applications | Conservative scenario inputs; Stage 1 adoption assumptions | Initial pipeline established; first pilot contract signed; Scorecard baselined |
| Year 2 - Pilots & Building | Convert pipeline into live deployments and validate the GTM proposition | Execute 2–3 paid pilots; refine value proposition from real-world feedback; identify and formalise strategic distribution partners; begin building shared ecosystem infrastructure | Conservative–Moderate transition; first on-chain KPI contributions visible | 2–3 live commercial deployments; first verified KPI contributions reported; GTM plan validated |
| Year 3 - Traction & Partnerships | Achieve repeatable commercial traction and institutional partnerships | Close strategic institutional partnerships; scale BD capacity; demonstrate repeatable deal flow; publish KPI progress to DReps and Product Committee; validate Scenario Modeling projections against actuals | Moderate scenario; validated KPI linkages replace modeled assumptions | Measurable contribution to North Star KPIs; 1–2 institutional partnerships signed; Scorecard moving from Amber to Green |
| Year 4+ - Scale & Growth | Institutionalise the vertical and achieve sustained ecosystem-level KPI impact | Expand geographies and adjacent market segments; grow ecosystem revenue; deepen institutional distribution channels; increase on-chain activity toward Optimistic scenario targets | Optimistic scenario; sustained multi-year KPI contribution | Sustained, compounding contribution to TVL, Monthly Transactions, and MAU; vertical self-sustaining via DRep-approved recurring funding |
Important Note on Scenario Modeling and the Timeline
The three scenarios (Conservative, Moderate, Optimistic) should always be expressed against this lifecycle timeline, not as alternative single-point forecasts. A well-constructed scenario output shows: at Year 1, Year 2, Year 3, and Year 4+, what does this vertical contribute to each KPI under each scenario? This makes it possible for DReps and the Product Committee to evaluate whether mid-year actuals are tracking toward Conservative, Moderate, or Optimistic projections, and to adjust resourcing accordingly.
3.3 Scenario Definitions
To eliminate subjective bias, the three modeling scenarios are strictly defined:
Conservative Scenario (Lower Bound Benchmark)
Assumes heavy adoption friction, slow enterprise sales cycles, regulatory headwinds, and minimal ecosystem tooling maturity. Business development (BD) pipeline conversion settles at the bottom decile of historical enterprise software benchmarks. Onboarding rates reflect organic, unassisted adoption.
- Application Context: Early-stage (Incubating) verticals, sectors facing complex cross-border regulatory uncertainty, or applications requiring unbuilt core infrastructure.
Moderate Scenario (Primary Planning Baseline)
Assumes standard commercial execution aligned with historical blockchain adoption curves in comparable emerging technology sectors. Key horizontal enablers (wallets, indexing, custody) are deployed on schedule. Enterprise pipeline conversion rates match mid-range industry averages (10–15%).
- Application Context: Verticals at Activation-Ready maturity. This scenario represents the formal baseline commitment evaluated by Intersect and DReps for milestone funding tranches.
Optimistic Scenario (Catalyzed Upside Ceiling)
Assumes strong structural tailwinds, including accelerated regulatory mandates (e.g., strict EUDR enforcement dates), major multinational commercial partnerships, institutional distribution integration, and viral network effects. Pipeline conversion reaches the top quartile.
- Application Context: Verticals with signed institutional letters of intent (LOIs), active government pilot mandates, or major tier-1 ecosystem integrations.
3.4 Shared Input Variables (Tiers 1–4)
The model utilises a standardised four-tier hierarchy of 15 input variables. While the quantitative values vary across scenarios, the underlying variable structure remains fixed:
Tier 1 - Market Scope Inputs (The Addressable Universe)
- Total Addressable Market (TAM - Actors): Total volume of potential operating entities or users in the target sector globally.
- Total Addressable Market (TAM - Financial Volume): Total annual financial or transactional volume flowing through the target vertical ( value).
- Serviceable Addressable Market (SAM): The addressable subset of the TAM accessible within Cardano’s technical, geographic, and regulatory reach.
- Target Penetration Rate (%): The modeled market share of SAM captured within the 3-year projection window.
Tier 2 - Adoption Rate Inputs (The Ramp Dynamic)
- Monthly Onboarding Rate: Gross number of newly activated economic actors onboarded onto Cardano-native solutions per month
- Time to First On-Chain Event (Months): Mean duration from initial commercial contract signing / user onboarding to the first verifiable on-chain transaction.
- 12-Month Retention Rate (%): Percentage of onboarded actors who remain actively transacting on- chain after 12 months.
- Monthly Churn Rate (%): Percentage of active transacting actors who become dormant in any given 30-day window.
Tier 3 - Activity Intensity Inputs (Per-Actor KPI Contribution)
- Transactions per Active Actor per Month: Mean number of on-chain transactions generated monthly by an active participant.
- Average Transaction Value (ATV - ADA Equivalent): Mean economic value transferred per transaction, used for protocol fee and economic throughput modeling.
- Wallet-to-Transaction Ratio: The structural ratio of unique active wallet addresses to total monthly transaction volume (calibrates the MAU ↔ Tx split).
- TVL Contribution per Actor ($): Capital or inventory value locked into Cardano smart contracts per active entity (applicable to DeFi/RWA verticals).
Tier 4 - Ecosystem Modifiers & Infrastructure Inputs
- Tooling Readiness Score (1–5): Qualitative/technical assessment of existing Cardano infrastructure (wallets, SDKs, oracles, indexing) supporting the vertical.
- BD Pipeline Conversion Rate (%): Probability weighting applied to enterprise and institutional accounts currently in the vertical BD pipeline.
- Ecosystem Partner Multiplier: Network multiplier capturing indirect onboarding driven by institutional aggregators, NGOs, or government platforms.
3.5 KPI Output Metrics
Applying the input variables to the Impact Vertical Chain yields projected contributions across the canonical 2030 KPI suite. Projections must be modeled at Year 1, Year 2, and Year 3 to evaluate the credibility of the growth curve.
3.6 Visual: Scenario Modeling Output Table
Figure 2 provides the mandatory standardised output presentation format required in all vertical funding submissions.
3.6 Visual: Scenario Modeling Output Table
| Cardano 2030 North Star KPI | Conservative Scenario | Moderate Scenario (Baseline) | Optimistic Scenario |
|---|---|---|---|
| **Monthly Active Users (MAU)**Target: 1,000,000 unique wallets | [12,500 wallets] | [45,000 wallets] | [120,000 wallets] |
| Monthly TransactionsTarget: ≥27,000,000 tx/month | [150,000 tx/mo] | [675,000 tx/mo] | [2,400,000 tx/mo] |
| **Total Value Locked (TVL)**Target: $3,000,000,000 | [$8,500,000] | [$35,000,000] | [$115,000,000] |
| Annual Protocol RevenueTarget: ≥16,000,000 ADA/year | [45,000 ADA/yr] | [202,500 ADA/yr] | [720,000 ADA/yr] |
| DRep Participation RateTarget: >70% active stake | [Direct Vote: +0.2%] | [Direct Vote: +0.8%] | [Direct Vote: +2.5%] |
| Vertical-Specific KPIe.g., Certified Hectares / RWA Volume | [25,000 ha / $5M RWA] | [110,000 ha / $28M RWA] | [450,000 ha / $95M RWA] |
3.7 Template: Scenario Modeling Input Sheet (Blank Form)
Vertical teams must populate the 15 input variables below, providing explicit citations or methodological justification for each value.
| Input Variable | Conservative | Moderate | Optimistic | Source / Empirical Anchor |
|---|---|---|---|---|
| 1. TAM (Total Actors) | [Industry census / market report] | |||
| 2. TAM (Financial Volume - $) | [Sector trade volume data] | |||
| 3. Serviceable Market (SAM) | [Geographic/regulatory filter] | |||
| 4. Target Penetration Rate (%) | [Comparable tech adoption benchmark] | |||
| 5. Monthly Onboarding Rate | [BD capacity & partner ramp] | |||
| 6. Time to First Tx (Months) | [Integration cycle estimate] | |||
| 7. 12-Month Retention Rate (%) | [SaaS / enterprise benchmark] | |||
| 8. Monthly Churn Rate (%) | [Historical cohort data] | |||
| 9. Tx per Active Actor / Month | [Derived from Impact Chain Layer 3] | |||
| 10. Average Tx Value (ADA) | [Commercial transaction value] | |||
| 11. Wallet-to-Tx Ratio | [Architecture specification] | |||
| 12. TVL Contribution / Actor ($) | [Collateral / escrow vault size] | |||
| 13. Tooling Readiness (1–5) | [Component 3 assessment score] | |||
| 14. BD Conversion Rate (%) | [Historical pipeline conversion] | |||
| 15. Partner Multiplier | [Institutional distribution reach] |
3.8 Guidance Notes for Scenario Modeling
Scenario Modeling Best Practices
- Model the Annual Ramp: Projections must document Year 1, Year 2, and Year 3 milestones. Funding tranches should be tied directly to near-term ramp achievements rather than distant 2030 targets.
- Mandatory Sensitivity Stress-Testing: Vertical authors must isolate the two highest-impact input variables (typically Monthly Onboarding Rate and Churn Rate) and conduct sensitivity sweeps (+25% variance) to illustrate fragility.
- Express Projections as Marginal Contributions: Always formulate projections as marginal additions to Cardano's totals (e.g., "This vertical contributes +45,000 MAU"), never as holistic claims about overall Cardano network health.
- Strict Accounting on Protocol Fees: Fee revenue projections must account for Cardano's deterministic fee formula (Fee = a × size + b) and script execution units, avoiding arbitrary flat fee assumptions.
4. Component 3 - The Bottleneck & Enabler Taxonomy
4.1 Purpose & Diagnostic Value
The Bottleneck & Enabler Taxonomy establishes a comprehensive diagnostic classification system to identify, categorize, and evaluate the specific structural factors that accelerate or constrain vertical adoption on Cardano.
Historically, when a vertical struggled to achieve meaningful traction, ecosystem post-mortems produced vague diagnoses (e.g., "market conditions were unfavorable" or "tooling was immature"). The Taxonomy replaces subjective narratives with an objective, five-category evaluation rubric. This enables the Product Committee and DReps to determine whether adoption shortfalls stem from flawed business development, missing horizontal infrastructure, regulatory friction, or unviable economics.
4.2 The Five Constraint Categories
Every vertical is systematically assessed across five core operational dimensions:
Category 1 - UX & Tooling (Technical Fitness)
Evaluates the availability, maturity, and usability of Cardano’s technical infrastructure relative to the specific user experience requirements of the target market.
- Common Bottlenecks: Seed phrase / wallet management too complex for non-crypto-native field operators; absence of mobile-first light clients for emerging markets; lack of plug-and-play Plutus smart contract templates; missing zero-knowledge proof verification primitives; immature indexing or oracle infrastructure.
- Key Enablers: Account abstraction / social login modules; enterprise SDKs abstracting UTxO complexity; mobile-optimized light SDKs; battle-tested reference smart contract architectures.
Category 2 - Liquidity & Economics (Financial Viability)
Assesses the availability of capital, currency stability, and economic incentive structures required to sustain continuous on-chain activity.
- Common Bottlenecks: Volatility of ADA making operational budgeting difficult; absence of local- currency stablecoins or fiat on/off-ramps in key operating jurisdictions; high transaction deposit (min-UTxO) costs relative to micro-transaction values; lack of deep secondary liquidity for vertical-specific tokens.
- Key Enablers: Native fiat-backed stablecoins (e.g., USDA, EUR, local currencies); institutional trade finance liquidity vaults; subsidized transaction fee pools or Hydra state channels for zero-cost micro-transactions.
Category 3 - Regulatory & Compliance (Legal Viability)
Examines the statutory, regulatory, and legal landscape governing blockchain deployments in the target market and geographic jurisdictions.
- Common Bottlenecks: Unclear legal recognition of smart contracts or on-chain land/commodity title registries; strict data residency and privacy mandates (e.g., GDPR right-to-be-forgotten vs. immutable ledger); complex licensing requirements for financial intermediary dApps.
- Key Enablers: Imminent compliance mandates driving urgent demand for blockchain auditability (e.g., European Union Deforestation Regulation - EUDR, Corporate Sustainability Due Diligence Directive - CSDDD); regulatory sandbox participation; formal government agency memorandums of understanding (MOUs).
Category 4 - BD Capacity & Market Access (Commercial Execution)
Evaluates the ecosystem's commercial execution capability, domain expertise, target account pipelines, and enterprise sales reach.
- Common Bottlenecks: Lack of dedicated, funded vertical leads with established enterprise relationships; uncoordinated, competing BD outreach by multiple Cardano entities creating buyer confusion; absence of packaged enterprise sales collateral and ROI models.
- Key Enablers: A dedicated vertical lead with 10+ years of sector domain experience; strategic distribution partnerships with tier-1 industry associations, NGOs, or multinational aggregators; unified enterprise pipeline management across Cardano entities.
Category 5 - Ecosystem Infrastructure & Coordination (Structural Alignment)
Evaluates the horizontal technical capabilities, standards bodies, and governance funding mechanisms that the vertical relies upon across the broader Cardano ecosystem.
- Common Bottlenecks: Fragmented data schemas preventing cross-dApp interoperability; missing shared identity standards (e.g., uncoordinated DID implementations); short-term, proposal-by- proposal grant cycles preventing multi-year commercial commitments.
- Key Enablers: Formalized Cardano Improvement Proposals (CIPs) establishing open vertical data standards; multi-year milestone-governed treasury funding allocations approved by DReps; active working groups convened under Intersect committees.
4.3 Visual: Bottleneck & Enabler Taxonomy Matrix
Figure 3 maps the core diagnostic matrix used across all vertical readiness assessments.
| Dimension | Primary Bottlenecks (Adoption Constraints) | Key Enablers (Adoption Accelerators) |
|---|---|---|
| 1. UX & Tooling | • Seed phrase complexity for non-crypto field users• Lack of low-bandwidth mobile-first wallet SDKs• Immature oracle and IoT real-world data connectors | • Social login / account abstraction light clients• Modular open-source enterprise SDKs, e.g. Mesh and Lucid• Optimised Plutus V3 / Hydra state channels |
| 2. Liquidity & Economics | • ADA price volatility impacting operational accounting• Scarce fiat on/off-ramps in target emerging markets• Min-UTxO storage deposit overhead on micro-assets | • Institutional stablecoin liquidity rails, USD/EUR• Dedicated RWA liquidity vaults and DeFi credit facilities• Batch transaction aggregation reducing per-event fees |
| 3. Regulatory & Compliance | • GDPR / data privacy conflict with immutable ledger• Unclear legal enforceability of tokenised RWA titles• Cross-border financial compliance and licensing barriers | • Urgent regulatory tailwinds, e.g. EUDR, CSDDD, and MiCA• Zero-knowledge compliance and verifiable credential proofs• Government sandbox partnerships and formal legal opinions |
| 4. BD Capacity & Market Access | • Absence of full-time domain-specialist vertical leads• Uncoordinated, overlapping BD outreach by rival teams• Lack of enterprise-grade ROI models and case studies | • Funded, dedicated vertical lead with sector network• Tier-1 institutional distribution partnerships, including NGOs and governments• Unified CRM pipeline and lead routing via Intersect |
| 5. Ecosystem Infrastructure | • Proprietary, siloed metadata schemas across dApps• Short-term grant funding cycles preventing multi-year BD• Lack of formal vertical governance and working groups | • Standardised CIP data schemas for sector interoperability• Multi-year milestone-governed DRep treasury allocations• Intersect Vertical Working Groups driving roadmap focus |
4.4 Template: Vertical Bottleneck & Enabler Assessment
Vertical teams must rate each dimension on a 1–5 scale (1 = Severe Bottleneck; 3 = Neutral / Developing; 5 = Strong Enabler) to establish an aggregate Vertical Readiness Score.
The scores establish an aggregate Vertical Readiness Score.
| Dimension | Score (1–5) | Key Bottleneck Present | Key Enabler Present | Strategic Corrective Action |
|---|---|---|---|---|
| UX & Tooling | [Specify tooling development or grant request] | |||
| Liquidity & Economics | [Specify stablecoin or liquidity-rail plan] | |||
| Regulatory & Compliance | [Specify legal or compliance architecture] | |||
| BD & Market Access | [Specify sales capacity and partner targets] | |||
| Ecosystem Infrastructure | [Specify CIP or standards-alignment action] | |||
| Overall Readiness Score | [Average / 5.0] | Maturity Stage: [Incubating Developing Activation-Ready - Scaling] |
4.5 Interpreting Readiness Scores & Maturity Stages
The composite Readiness Score dictates the appropriate ecosystem funding and operational strategy:
- Score 1.0 – 2.0 (Incubating): The vertical faces severe, unaddressed structural blockers (e.g., missing foundational smart contract tooling or prohibitive regulatory ambiguity). Action: Do not fund large-scale commercial BD. Direct modest R&D grants strictly toward resolving technical blockers.
- Score 2.1 – 3.5 (Developing): Foundational capabilities exist, but critical operational gaps remain (e.g., basic dApp built, but no fiat payment rails or dedicated BD lead). Action: Fund targeted milestone sprints to eliminate identified bottlenecks while conducting preliminary enterprise customer discovery.
- Score 3.6 – 4.5 (Activation-Ready): Technical tooling, regulatory posture, and economic primitives are viable. Primary requirement is commercial execution capacity. Action: Authorize full multi-year vertical funding, establish a dedicated BD desk, and pursue enterprise pipeline conversion.
- Score 4.6 – 5.0 (Scaling): Strong market pull, mature horizontal infrastructure, robust liquidity, and proven enterprise conversion. Action: Scale geographic expansion, deepen institutional integrations, and optimize protocol throughput.
5. Component 4 - The Vertical Impact Scorecard (v1)
5.1 Purpose & Governance Function
The Vertical Impact Scorecard is a standardised, one-page operational management and governance reporting instrument designed for vertical leads, the Intersect Product Committee, and DReps.
The Scorecard serves two vital governance functions:
- Internal Operational Planning: Enables vertical leads to maintain quarterly accountability across pipeline milestones, technical deliverables, and KPI trajectories.
- External Governance Accountability: Provides DReps and funding bodies with a clean, unmanipulated snapshot of actual performance versus baseline commitments, replacing verbose, narrative-heavy progress reports with objective data.
5.2 Five-Part Scorecard Architecture (Sections A–E)
The Scorecard integrates the entire framework into five structured modules:
- Section A - Vertical Identity & Metadata: Formally registers the vertical name, operating entity, dedicated vertical lead, maturity stage, and a crisp one-sentence strategic mandate.
- Section B - KPI Trajectory & Performance Tracking: Tabulates core 2030 KPIs, multi-year Scenario Modeling targets, actual realized metrics to date, and an automated Red/Amber/Green (RAG) health indicator.
- Section C - Bottleneck & Enabler Health: Summarizes the current 1–5 readiness scores across the five diagnostic dimensions and highlights the top active blocker and catalyst.
- Section D - Commercial Pipeline & Conversion Metrics: Documents funnel metrics (Total Accounts, Active Deals, Converted On-Chain Accounts) and tracks the top three near-term enterprise opportunities.
- Section E - Quarterly Narrative & Forward Commitments: A concise 3-bullet operational retrospective followed by three explicit milestone deliverables committed for the upcoming quarter.
5.3 Visual: The Vertical Impact Scorecard (v1 Form)
Figure 4 presents the complete, standalone one-page Scorecard template. The example below is completed for an agricultural supply chain vertical; teams applying the framework to other verticals should replace all field entries with their own industry-grounded content — the structure and categories remain the same across all verticals.
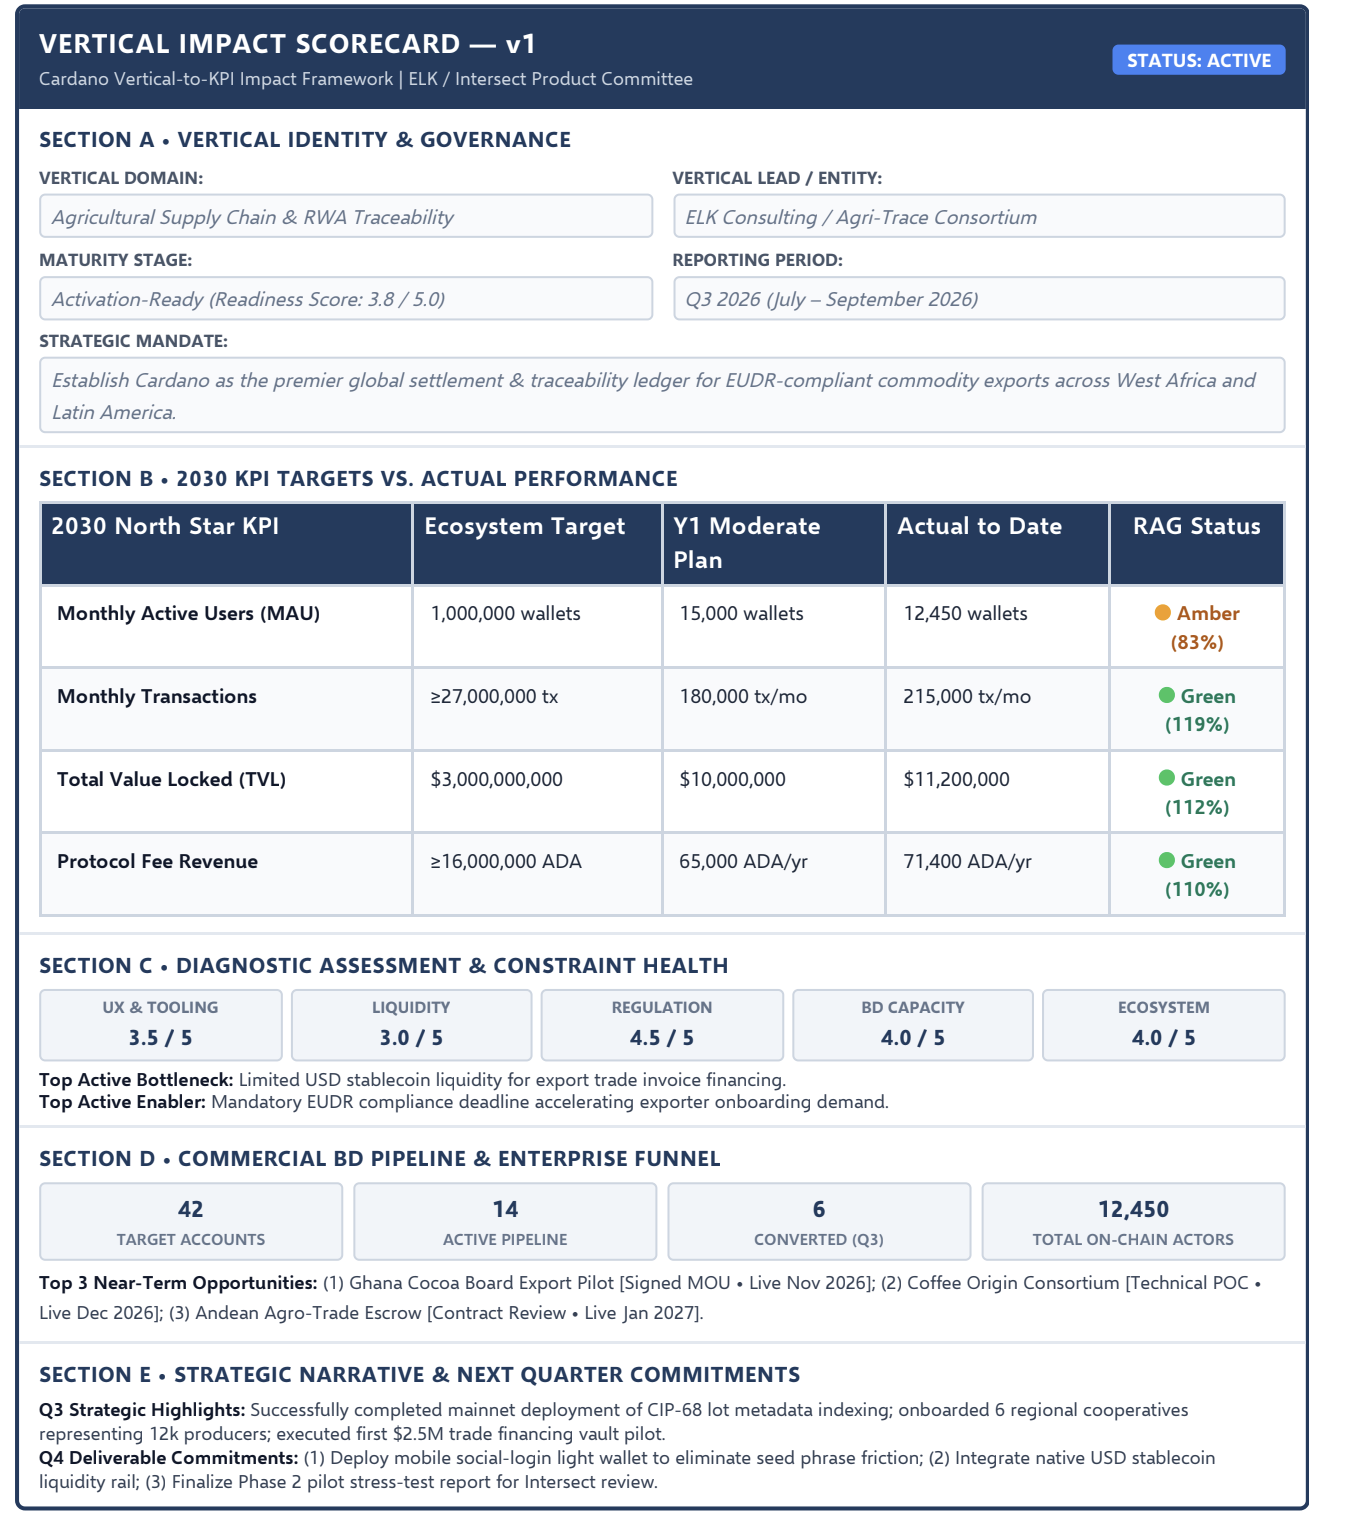
This scorecard contains information about the Agri-spply chain vertical, which is the vertical we are currently the most advanced with. The scorecard can be different depending on the vertical. We are still planning to create a general template for the next milestone.
5.4 Guidance Notes for Scorecard Reporting
Governance Reporting Protocols
- Mandatory Submission at Funding Application: The Scorecard must be populated as an ex-ante planning baseline during initial proposal submission, establishing the contractual performance standard.
- Standardized Quarterly Cadence: Vertical leads must submit updated Scorecards every 90 days. Unexcused failure to submit triggers an automatic hold on scheduled treasury disbursements.
- RAG Integrity & Transparency: An Amber or Red RAG status is not considered a failure; it represents critical operational data allowing Intersect and DReps to allocate corrective technical or liquidity support. Falsifying green status constitutes a breach of governance mandate.
- Summary Instrument: The Scorecard is an executive summary. Detailed technical queries must reference the underlying Impact Chain, Scenario Models, and Diagnostic Matrices.
6. Framework Integration - How the Four Components Connect
6.1 The Logical Sequence
The four framework components operate as a tightly coupled, sequential analytical pipeline. Each module provides the formal mathematical and structural inputs required by the subsequent tool:
- The Impact Vertical Chain establishes the fundamental qualitative and causal architecture, defining precisely which real-world actors execute which activities, what on-chain events are produced, and which 2030 KPIs are triggered.
- The Scenario Modeling Engine quantifies this causal architecture, taking the discrete event frequencies and wallet ratios from the chain to project exact numerical contributions across Conservative, Moderate, and Optimistic adoption curves.
- The Bottleneck & Enabler Taxonomy diagnoses the operational probability landscape, evaluating whether current tooling, liquidity, and regulatory conditions will push actual performance toward the Conservative lower bound or the Optimistic ceiling.
- The Vertical Impact Scorecard packages the outputs into an actionable, standardized operational executive dashboard that bridges day-to-day execution with ecosystem governance oversight.
6.2 The Dynamic Feedback Loop
Crucially, the framework is designed as a continuous bi-directional feedback loop rather than a static one-off filing:
- Real-World Calibration: As quarterly Scorecard actuals are recorded, empirical variance triggers recalibration of Scenario Modeling variables (e.g., if actual Churn Rate is 4.5% versus the assumed 2.0%, input parameters must be formally updated).
- Diagnostic Iteration: Changes in the Bottleneck assessment (e.g., the launch of a new native stablecoin resolving Liquidity constraints) dynamically shift baseline trajectory targets from Moderate toward Optimistic projections.
6.3 Cross-Vertical Comparability & Resource Allocation
By enforcing a universal causal structure, identical variable taxonomy, and uniform Scorecard reporting across all participating domains, the framework provides the Intersect Product Committee and DReps with an objective, data-driven foundation for ecosystem capital allocation.
For the first time, governance bodies can directly compare disparate initiatives—evaluating whether a $500k treasury allocation in Agriculture yields a superior risk-adjusted KPI contribution compared to an equivalent allocation in Bitcoin DeFi or Governance tooling.
7. Validation Plan
This document constitutes the formal v1.0 Draft of the framework toolkit. In accordance with the funded proposal roadmap, the framework will undergo a multi-stage empirical validation and refinement process:
- Expert Practitioner Review (Phase 1, Weeks 4–5): The draft templates and modeling engine will be submitted to three independent domain experts representing the pilot verticals (Agricultural Supply Chain, Bitcoin DeFi, and Decentralized Governance) to audit assumption credibility, variable completeness, and commercial usability.
- Phase 2 Pilot Application Stress-Tests (Phase 2): The framework will be deployed in full across the three dedicated pilot vertical deliverables:
- Pilot 1: Agricultural Supply Chain & Real-World Asset Traceability
- Pilot 2: Bitcoin DeFi & Cross-Chain Liquidity Infrastructure
- Pilot 3: Civic & Ecosystem Governance Coordination Tooling
Any structural edge cases or parameter limitations identified during pilot execution will be synthesized into a formal framework revision.
- Community & Builder Workshop (Phase 1, Week 7): A public, interactive workshop will be hosted with approximately 30 active Cardano ecosystem developers, SPOs, and enterprise builders to gather open feedback on tooling usability and reporting burden.
- Governance Review & Intersect Submission: The finalized v1.1 framework package will be presented to the Intersect Product Committee and published open-source for DRep integration on the Intersect platform.
Appendix A — Glossary
Appendix A — Glossary
| Term | Formal Framework Definition |
|---|---|
| Vertical | A coherent external industry, economic sector, or public domain (e.g., Agriculture, Energy, Supply Chain) around which Cardano develops specialized relationships, tailored dApps, and repeatable GTM motions. |
| Horizontal (Capability) | A reusable, cross-cutting technical, financial, or delivery capability (e.g., DID identity, DEX liquidity, oracles, indexing) that serves multiple verticals simultaneously. |
| Impact Vertical Chain | The five-layer causal architecture tracing real-world actor activities through on-chain events to quantifiable contributions to Cardano’s 2030 North Star KPIs. |
| Scenario Modeling Engine | The standardized forecasting methodology modeling vertical adoption across Conservative, Moderate, and Optimistic curves using 15 shared input variables. |
| Bottleneck | A structural technical, economic, regulatory, commercial, or coordination constraint that restricts a vertical’s on-chain adoption below its potential. |
| Enabler | A catalytic structural factor, market tailwind, or technical primitive that accelerates vertical adoption and pipeline conversion. |
| Vertical Impact Scorecard | The standardized one-page operational management and governance dashboard summarizing KPI targets, actuals, RAG health, and commercial pipeline status. |
| Monthly Active Users (MAU) | The count of unique Cardano wallet addresses that successfully execute at least one on-chain transaction within a rolling 30-day window. |
| Total Value Locked (TVL) | The aggregate USD-equivalent value of all native assets, collateral, and liquidity locked inside Cardano smart contracts and state channels. |
| KPI Contribution | The marginal, quantifiable addition that a specific vertical provides toward an ecosystem-wide 2030 KPI target. |
| RAG Status | Red / Amber / Green performance health indicator. Green: on or exceeding trajectory (≥90%); Amber: at risk (70–89%); Red: severely lagging (<70%). |
Appendix B - Connection to Proposal Deliverables
Table B1 explicitly maps each core component delivered in this document to its corresponding proposal milestone commitment under Task P1-4.
| Proposal Task | Deliverable Component Description | Status | Document Section |
|---|---|---|---|
| Task P1-4 (Part 1) | Impact Vertical Chain Template: Fully documented, reusable five-layer causal architecture mapping real-world actions to 2030 KPIs. | Delivered (v1.0) | Section 2 - Figures 1 and Template Form |
| Task P1-4 (Part 2) | Scenario Modeling Engine: Standardized three-tier forecasting engine with 15 shared variables and multi-scale KPI output matrices. | Delivered (v1.0) | Section 3 - Figure 2 and Input Sheet |
| Task P1-4 (Part 3) | Bottleneck & Enabler Taxonomy: Five-dimension diagnostic classification matrix and Readiness Scoring rubric. | Delivered (v1.0) | Section 4 - Figure 3 and Assessment Form |
| Task P1-4 (Part 4) | Vertical Impact Scorecard (v1): Standardized one-page operational management and DRep governance reporting instrument. | Delivered (v1.0) | Section 5 - Figure 4 and Guidelines |